HAPPY MONDAY EVERYONE! Just wanted to give you guys a quick update: I am still pyrolyzing samples.
Last Friday we pyrolyzed pure bentonite to use as a reference and compare to those contaminated samples as well as those with the added catalyst.
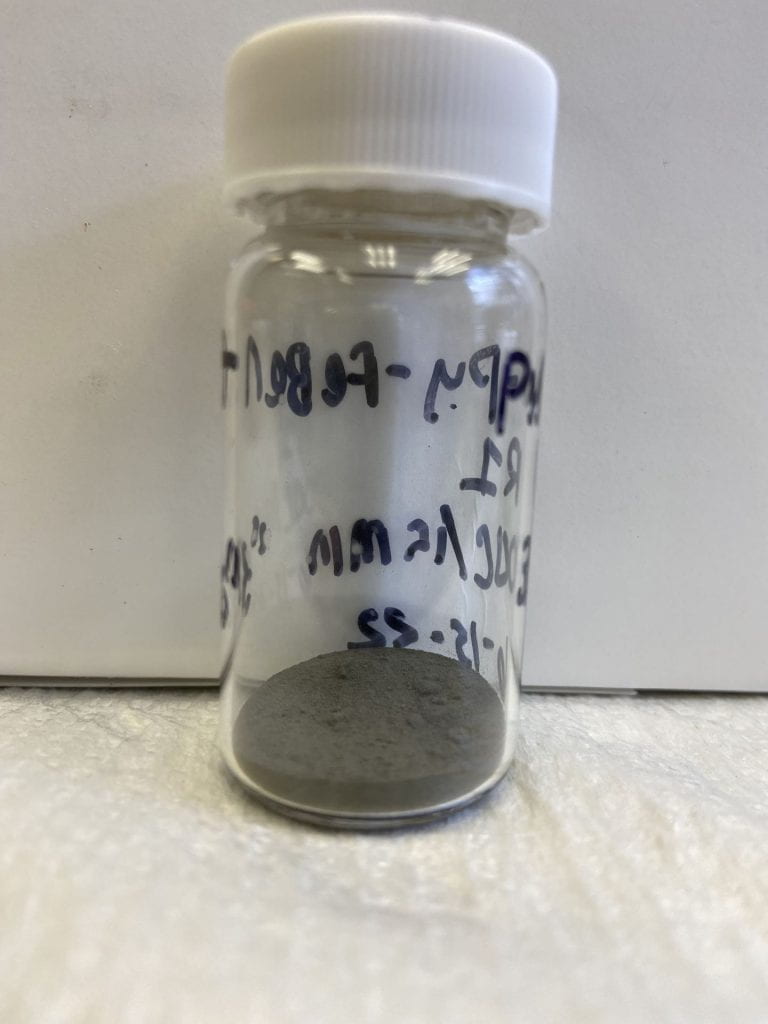
Pyrolyzed Bentonite
As you can see there is no major color change, in fact it looks a bit lighter than the bentonite alone. Our sample was originally 7g however we only collected 5.50g. These may have been due to improper loading of the mesh squares in our reactor. In fact we used 9 mesh instead of the typical 7 but hey that’s science!
Week 4 was awesome after a previous week of lab hurdles that we (successfully) got past! We started the week with brand new cells and continued gracefully with our experiment.
During the beginning of last week, we began applying our experimental reagent to certain cell cultures to complete the first run of our experiment. The cells applied with the experimental reagent earliest died within 24 hours.
As a teacher-scientist, it was easy for me to draw a conclusion that maybe the experimental reagent affected the cells in the opposite way that we expected, but I stopped myself and thought about the properties of the reagent. After analyzing all the information simultaneously, I concluded that it was strange for the cells to immediately die as the reagent should have promoted specific cell differentiation. I brought this to my mentor, and he agreed and mentioned that the cell densities we used may have contributed to such quick cell death.
We have continued our experimentation and moving forward, decided to use higher cell volumes in our next experiment of the project.
As a teacher-scientist, I seek to make clear, direct connections during experimentation. This may be because I seek to offer hands-on experiences to apply to previously taught concepts with experimentation in the classroom. However, as a researcher-scientist, it is important to consider all variables and conditions of the experiment before making any analysis.
After preparing the liquid culture we worked in the mini prep process. We used enzymes, a buffer and nuclease water. The volume of reagents (ul) used are instructed per manufacturer. After have all the enzymes and buffer mixed in the “15 ml” (Canonical tube) we took our samples to the biological safety cabinet (BSC).
Disinfect BSC before and after
We disinfected the BSC first and all pipettes with ethanol before we started to work in the BSC. After add the water in the tubes, we are ready to take the tubes to the centrifuge.
Where is the centrifuge?
Main room near the Nitrogen tank…
The position of the samples inside the centrifuge is important to keep the balance. Look at the diagrams with instructions on how to position each tube on the right side of the centrifuge.
Centrifuge
Next, we used the spectrophotometer- Nanodrop 2000 c, to find concentration of DNA.
Lets see concentration of DNA
Take away from this experience: We learn by observing and doing . Remember, be patience with yourself.
Wow! We only have two weeks left and still so much to do 😬. I spent some of my time this week working on the script and frames for my whiteboard video. Here’s a little sneak preview of that:
I can’t wait to start filming soon. Hopefully, my prep work will pay off in the video. In the lab this week, I’ll be finishing up data analysis with my mentor and working on a rough draft of my research poster.
Hello all! This week we have continued to conduct counts of Symbiodiniaceae cells to determine the number of dead and alive cells in a sample using the hemocytometer. I did get a couple of samples that were absolutely beautiful! They were so easy to count and the live symbionts were easily spotted as they were perfectly golden in color (pictured below).
View through the Hemocytometer, the golden rounds cells are the live Symbiodineaceae cells. The grid on the slide helps us to keep track of the cells we have counted. We have been counting between 20 – 500 living Symbiodiniaceae cells in our samples!Freezer boxes storing the filtered and unfiltered samples of fish poop!
The samples that we are doing cell counts on are fish poop samples collected from various fishes that were dissected in the Caribbean. We have around 56 samples in total. A big part of the process has been to filter the samples and we finally finished all of our filtrations this week! This has been a big win. We will be finishing our counts soon as well so I will get to start analyzing the data for my research poster.
Summer research is flying by. I have greatly enjoyed my time working with some of the brightest men and women in the field of nanotechnology, specifically graphene. I now have a firm grip on the research process, lab techniques, and characterization techniques. I have now transitioned into specific research regarding how nanotechnology (graphene) can be used in improving water quality throughout the world. The big problem I am researching involves, forever chemicals know as PFAS. There are over 4700 chemicals in this category. One of the optimal goals is to have have graphene filters remove the PFAS chemicals captured from the water, then taking those PFAS chemicals and turning them into a heteroatomic- graphene bonded with fluorine which has additional beneficial features. This week, I cut open a carbon filter made from coconut, then subjected that material to the flash joule heating (FJH) process. I was surprised that the filter material did create some high quality graphene. Next week we are going to generate additional graphene made from the filter, mix it with actual PFAS to determine whether a heteroatomic bond with Fluorine is created. I am excited to see what we can determine.
Cut up water filter, used to make graphene
Will try laser induced method to create graphene from the filter
Pictured are Bing Deng on my left and Gang Li on my right. Incredibly intelligent researchers with many published papers. All of the researchers in Dr. Tour’s lab have been of great help
The Image on the left shows all the known PFAS contamination sites throughout the country.
The week concluded with a seminar from a former Rice graduate, now a Professor in Paris discussing Molecular Tweezers.
Mrs. Garza and I
My wife and I enjoyed a great night of Dynamo Soccer featuring the debut of HH. July is my favorite month of the year.
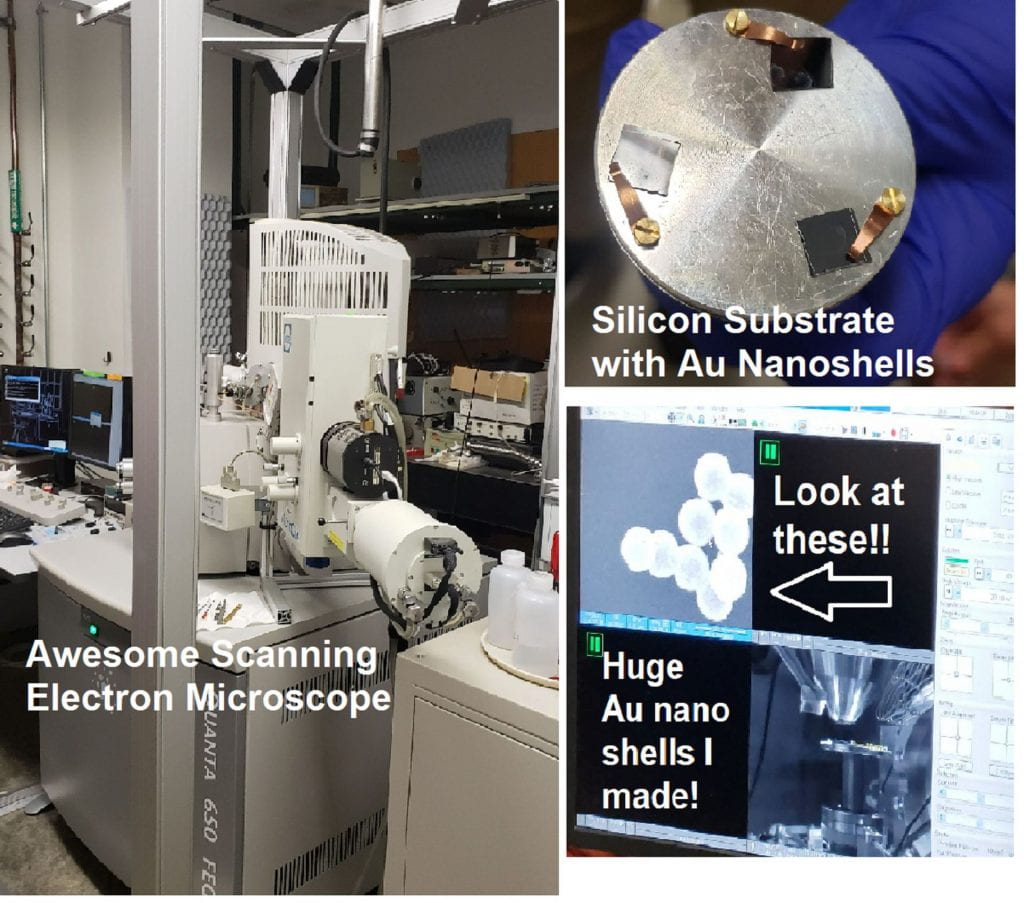
Finally made good gold nanoshells and gold nanoparticles that actually dried! Even more exciting, I got to see those particles under a scanning electron microscope!! I can tell you, if you’ve never seen how these machines work, you’re missing out. I am excited to show these to my students and explain how I got these images 🙂 Thank you Oara and Andres for taking the time to teach me so much!
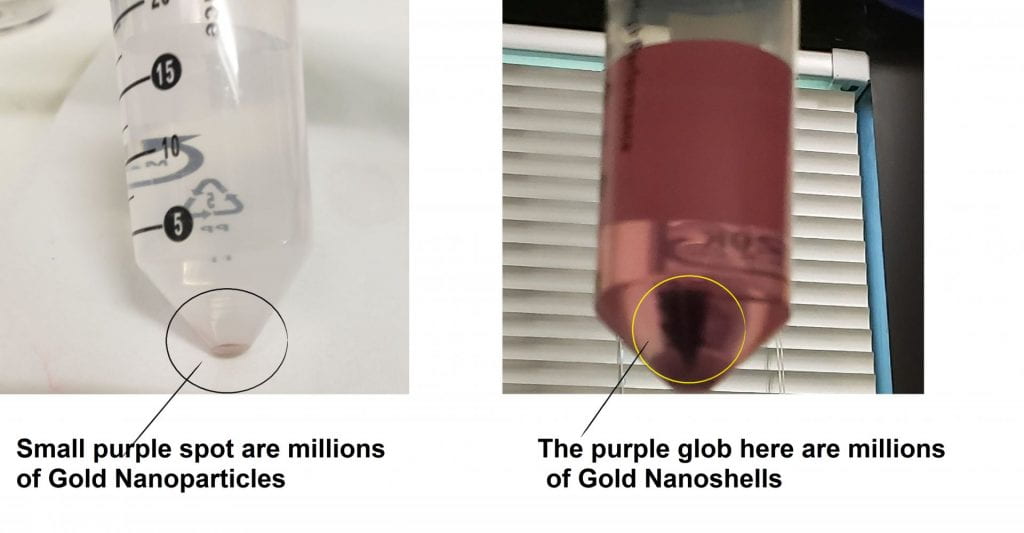
So what’s the difference between nanoparticles and nanoshells? The short answer is size and preparation. The gold nanoparticles we prepared were made by adding 300 mL KCarb solution (which is made of 100 kg of potassium carbonate in 400 ml of water and 6 mL of gold) and 800 microliters of formaldehyde. When mixed thoroughly on a hot plate, the reaction changes from a clear to a blue solution first and then to red or red/orange depending on the concentration. For gold nanoshells, we used 180 nm Aminated Silica spheres to the gold colloids which is used to seed the shells and then added the KCarb and formaldehyde. Just like you can see the size difference between nanoparticles and nanoshells here, when we made the samples, I could only see a dot at the bottom of the test tube which were millions of nanoparticles. Nanoshells produced a little more in the test tube that you could actually see. SAME NANOPARTICLES AND SHELLS AS ABOVE SEEN UNDER THE SCANNING ELECTRON MICROSCOPE
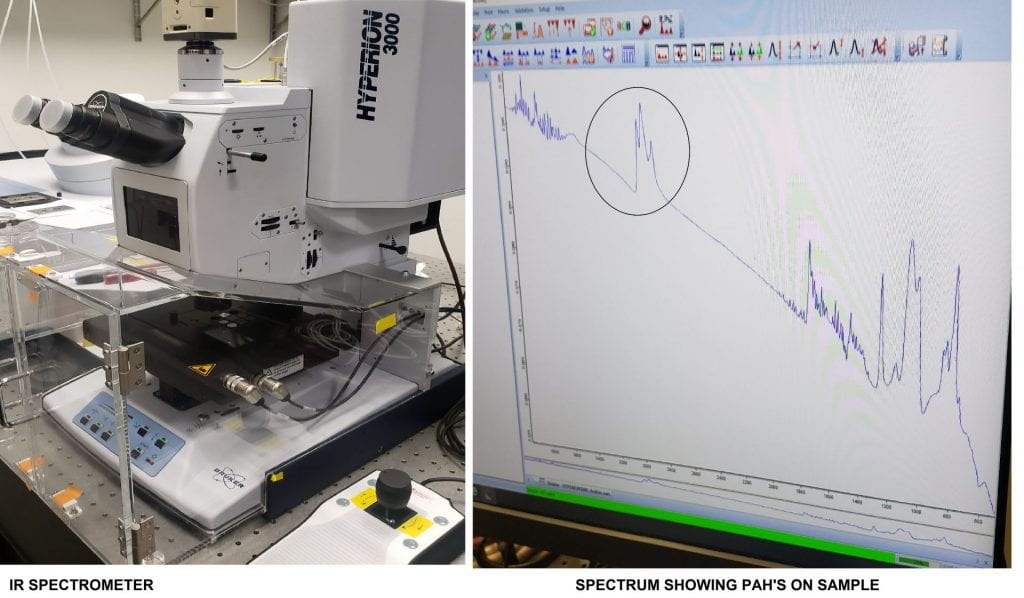
I even got to see the infrared spectrometer and see how the spectrum compares to the Raman spectra. Thank you to all that made it possible for me to have this experience. Truly AMAZING! So much more work to be done!! And only 2 weeks left 🙁
Last week, I had the pleasure of visiting Ms. Mason’s lab! She seems to be doing some super awesome research with her lab mentors, as they are using electricity to improve the efficiency and quality of our drinking water! I most definitely look forward to seeing how this all turns out!
This Past Week:
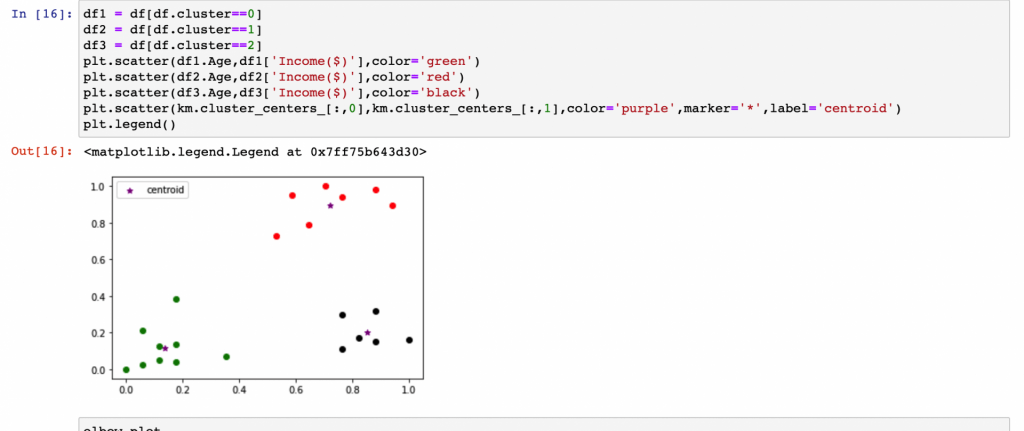
This past week, I have been able to finally my head around different imperative statistical python analysis that I will be implementing into my project such as :
Linear Regression
Logistic Regression
As Well As KMeans ClusteringLooking Forward to Implementing these Methods in my Research!
Hello RETs can you believe we are wrapping up week 4? Time really flies by and I know we’ve all been hustling in our labs. Here are a few updates I want to share with you all:
Week 3
We collected and paralyzed all of our iron samples (6). From left to right you see: Iron Bentonite & Pyrolyzed Iron Bentonite; Pyrene Iron Bentonite & Pyrolyzed Pyrene Iron Bentonite; Hexacosane Iron Bentonite & Pyrolyzed Hexacosane Iron Bentonite.
Samples were contaminated at a 0.1% concentration (1000mg/kg)
We collected and paralyzed all of our copper samples (7). From left to right you see: Copper Bentonite & Pyrolyzed Copper Bentonite; Pyrene Copper Bentonite & Pyrolyzed Pyrene Copper Bentonite (2); Hexacosane Copper Bentonite & Pyrolyzed Hexacosane Copper Bentonite. Our pyrene copper bentonite copper sample had to be done twice due to the temperature increase on the first round.
Samples were contaminated at a 0.1% concentration (1000mg/kg)
Week 4
We pyrolyzed a 2.5% contaminated pyrene bentonite sample which produced a light gray color when compared to those impregnated with iron and copper. Iron has the darkest “char” colored feature which indicates that iron catalyzed the formation of char at a lower temperature.
2.5% Pyrene Bentonite
0.1% Iron Pyrene Bentonite*
0.1% Cupper Pyrene Bentonite*
2.5% Pyrene Bentonite*
*All samples were paralyzed at a temperature of 300c at a rate of 15c/min (about 21 minutes).
Extractions of the the pyrene bentonite and pyrolyzed pyrene bentonite samples were then performed using a 2:1 ratio of sample to DA (drying agent). Acetone was the only solvent used for these extractions.
Extracted Pyrene Bentonite
Extracted Pyrolyzed Pyrene Bentonite
This color change may be indicative that pyrene is breaking down into other molecular fragments and/or forming byproducts that are abundantly present and visible via the GCMS. The question is why exactly our extractions changing color and what is synthesizing or breaking via the pyrolysis of pyrene in bentonite?
We do the analysis of amino acid for N-15 and C-13 abundance in five different Amino Acids ( Tyrosine, Leucine, Glycine, Glutamic Acid and Aspartic Acid) by using Elemental Analyzer/isotope ratio mass spectrometry in instrument name Delta V plus- IRMS.
We find out that Tyrosine is having highest number of N-15 isotopes and Aspartic Acid and Glutamic.
We understand the simple phenomenon where fish eats algae which are having δ15N. And when fish urinate than less amount of δ15N came out. Finally, when human being eats those fish than they get higher amount of δ15N and also during removing waste human also excrete less δ15N. And this Nitrogen played major role in protein synthesis.
Sample of Amino AcidsMaking SamplesIsobat Ready Elemental Analyzer- Delta V Plus
K-12 Educators Disseminating Research from Rice University, Arizona State University, University of Texas-El Paso, and Yale University